Index Numbers and Weighting
In this tutorial, you will learn:
- Index Numbers
- Price Index
- Price Relative
- Weighting
- Simple Aggregative Index
- The Expenditure Index
- Laspeyre's price index
- Paasche's price index
- Consumer Price Index - CPI
- Retial Price Index - RPI
Index Numbers
The word, index, has a pleasant ring attached to it in our daily lives. For instance, just imagine a complex text book or a retail catalogue like Argos without its corresponding index at the back. When we want to find a particular word in the textbook or an item in the catalogue, the index comes to our rescue: it makes our search so much easier and more often than not, takes us to the right page or location.
The beauty of an index doesn't just end there. Google, the search giant, maintains a gigantic index of websites while giving them a rank in proportion to their corresponding significance to a given search item.
So, indexing data has a real advantage in many areas of our lives.
The following chart shows one of the most famous indices in the world of economics - NIKKEI225:

The index numbers in the field of economics do the same for those who have to analyse data in an efficient manner; they make the change of a pattern much more vivid.
Two German academics in the 19th century played a crucial role in coming up with Index Numbers in the field of economics. They are Professor Ernst Louis Étienne Laspeyres and Professor Hermann Paasche.

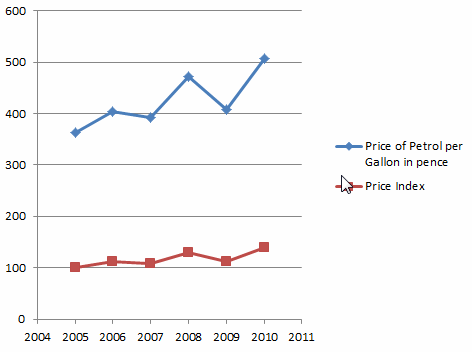
For example, suppose we want to study how the price of petrol has increased
since, say 2005, year-on-year basis in the United Kingdom and we look at a set
of data, which is as follows:
|
Year |
Price per Gallon in pence |
|
2005 |
363 |
|
2006 |
404 |
|
2007 |
393 |
|
2009 |
472 |
|
2008 |
408 |
|
2010 |
508 |
As you can see, the prices are there and a subtle fluctuation can be seen in the price column. It, however, is not indicative enough to spot a clear pattern.
In this situation, we define an index number to study the pattern more clearly. In order to do that:
- We must first declare a base year.
- Then, based on the formula,
index number = (price in a particular year/price in the base year) x 100,
we calculate the index number, for every year.
One of the biggest potential challenge that can arise in the calculation of the index numbers is the choice of the base year.It should be a year in which neither the price nor the weight or volume is subjected to unnatural events such as weather, sudden political changes or regional conflicts.
Since the Index Number involves a single price variation, this is also called, Price Relative.
Price Relative = [Pn / P0] X 100
P0 = Price in the base year; Pn = Price in the nth year
Suppose the base year is taken as the year 2005. Then the index number for each year is calculated as follows:
- Index number or price relative for 2005 = 363/363 X 100 = 100
- Index number or price relative for 2006 = 404/363 X 100 = 111
- Index number or price relative for 2007 = 393/363 X 100 = 108
- Index number or price relative for 2008 = 472/363 X 100 = 130
- Index number or price relative for 2009 = 408/363 X 100 = 112
- Index number or price relative for 2010 = 508/363 X 100 = 140
Now, let's add another column to our data table as the index number or
price index and the difference it is going to make in data analysis.
|
Year |
Price per Gallon in pence |
Index Number or Price Relative |
|
2005 |
363 |
100 |
|
2006 |
404 |
111 |
|
2007 |
393 |
108 |
|
2008 |
472 |
130 |
|
2009 |
408 |
112 |
|
2010 |
508 |
140 |
Since the index number of the base year - 2005 - is always 100, it is easy for us to study the fluctuation in price in the given set of data:
Example
- In 2006, the price has gone up by 11%.
- in 2010, the price has gone up by 40%
- From 2008 to 2009, there is a price drop by 18%
Please move the mouse over each country to see the figure:
The following animation illustrates both the petrol price and the petrol price index from 2005 to 2010.
Weighted Index Numbers
Most of the time, we calculate the index numbers while attaching a proportional significance to the prices in question. It gives a better value for price comparisons over the years.
Example
Suppose that in a simple grocery list, there are the prices of 1kg of potato, 1kg
of sugar and 1kg of flour and their corresponding quantities in the year 2011.
The quantity gives the weight for each price. Therefore, an index calculated as follows becomes a
weighted index for that particular year - say, for 2011.
|
Item |
Price per kg in pence |
Quantity in kg |
|
Potatoes |
20 |
5 |
|
Sugar |
70 |
2 |
|
Flour |
52 |
7 |
Weighted Index = Σ[( Pi x Wi] / ΣWi
P - Price; W - Weight
Weighted Index = Σ[( Pi x Wi] / ΣWi
= [20 X 5 + 70 X 2 + 52 X 7] / [5 + 2 + 7]
= [100 + 140 + 364]/14
= 43.1
Let's extend the index numbers and weighted index numbers to cover wider areas of data.
Example
|
Meal Type |
Meals for 2010 |
Meals for 2011 |
|
Price per meal in pence |
Quantity |
Price per meal in pence |
Quantity |
|
Fish & Chips |
180 |
20 |
200 |
18 |
|
Pizza |
160 |
22 |
180 |
17 |
|
Rice & Curry |
220 |
18 |
240 |
20 |
|
Roast Lunch |
240 |
15 |
260 |
11 |
Simple Aggregative Index
The Simple Aggregative Index is calculated by using just the unit price of the each item, relative to a base year. Suppose we take the year 2010 as the base year.
Simple Aggregative Index = [ΣPi / ΣP0] X 100
P0 = prices in the base year; Pi = prices in the subsequent years
Simple Aggregative Index = ΣPi / ΣP0
= (200 + 180 + 240 + 260) / (180 + 160 + 220 + 240) X 100
= 110
There are two major issues associated with Simple Aggregative Index. They are:
- The variation of prices of the meals
- The possibility of a meal being priced as two sub units - fish or chips separately, for instance.
This issue can be addressed by the use of weighted index.
The Expenditure Index
The expenditure index is calculated by using both the unit price and the quantity for each item. It is far more accurate when it comes to comparing the expenditure over the years than simple aggregative index.
The Expenditure Index = Σ[PiWi / ΣP0W0] X 100
P0, W0 = prices and weight for the base year
Pi, Wi = prices and weight for the subsequent years
Now, let's calculate it while taking the base year as the year 2010.
The Expenditure Index = Σ[PiWi / ΣP0W0] X 100
= [ 200 X 18 + 180 X 17 + 240 X 20 + 260 X 11] / [180 X 20 + 160 X 22 + 220 X 18
+ 240 X 15]
= 97.5
Laspeyre's price index
Laspeyre's price index, also known as base-weighted index or fixed-weighted index, calculates the index number using the weight of the base year as weight while ignoring the weight of subsequent years.
Professor Ernst Louis Étienne Laspeyres (November 28, 1834 – August 4, 1913), an academic of economics and statistics in Germany came up with this index. It was one of the many contributions made by the German mathematician into the field of economics.
Laspeyre's price index = [ΣPiW0] / [ΣP0W0] X 100
Since only the base quantities are used for the calculations, the changes which are only due to price changes can be studied through this index.
Example
|
Meal Type |
Meals for 2010 |
Meals for 2011 |
|
Price per meal in pence |
Quantity |
Price per meal in pence |
Quantity |
|
Fish & Chips |
180 |
20 |
200 |
18 |
|
Pizza |
160 |
22 |
180 |
17 |
|
Rice & Curry |
220 |
18 |
240 |
20 |
|
Roast Lunch |
240 |
15 |
260 |
11 |
Laspeyre's price index = [ΣPiW0] / [ΣP0W0] X 100
= [200 X 20 + 180 X 22 + 240 X 18 + 260 X 15] / [180 X 20 + 160 X 22 + 220 X 18
+ 240 X 15] X 100
= 110.2
Paasche's price index
Paasche's price index price index, also known as end-year-weighted index, calculates the index number using the weight of the end year as weight while ignoring the weight of the base year.
Professor Hermann Paasche (February 24, 1851 – April 11, 1925), an academic of economics and statistics in Germany came up with this index. He was a gifted statistician and economist.
Paasche price index = [ΣPiWi] / [ΣP0Wi] X 100
Using the above set of data, the index can be calculated as follows:
Paasche's price index = [ΣPiW0] / [ΣP0W0] X 100
= [200 X 18 + 180 X 17 + 240 X 20 + 260 X 11] / [180 X 18 + 160 X 17 + 220 X 20
+ 240 X 11] X 100
= 110.1
Other Major indices used in Economics
- Consumer Price Index: CPI - A measure of the average change over time in the prices paid by cosmopolitan consumers for a market basket of consumer goods and services in the US.
- Retail Price Index: RPI - A measure of the change in the cost of a basket of retail goods and services in the UK.
Exercises
- The price of a desktop in 2007, 2008, 2009 is £750, £600 and £ 450 respectively. Construct a price index with base year as 2007.
- The ticket price on London Underground between two particular stations is £1.20, £1.30, £1.50 and £1.65 in 2004, 2005, 2006 and 2007 respectively. Construct a ticket price index with the base year as 2004.
- Construct a price index for bread, fish and lamb by using the information given below with base year as 2002:
|
Item |
Price in pence |
|
2002 |
2003 |
2004 |
|
Bread |
65 |
72 |
85 |
|
Fish |
120 |
140 |
155 |
|
Lamb |
800 |
986 |
1020 |
- The shares bought by three friends in a certain company are as follows. Find the Simple Aggregative Index, The Expenditure Index, Laspeyre's price index and Paasche's price index with the base year as 2008.
|
Person |
Price and Quantity |
|
2008 |
2009 |
|
Price |
Qty |
Price |
Qty |
|
Sam |
90 |
50 |
85 |
30 |
|
Judith |
100 |
40 |
155 |
40 |
|
Viraj |
200 |
60 |
102 |
20 |
Answers
- 100, 80, 60
- 100,108.3, 125, 137.5
- Bread - 100, 110.7, 130.7: Fish - 100, 116, 129.1: Lamb - 100, 123.2, 127.5
- SAI - 87.8: TEI - 52.6: LI - 80.8: PI - 100.8
The latest data in the RPI in the UK is as follows: