Drawing Curves
In this tutorial, you will learn how to draw curves; they include the following:
- How to draw an arc.
- How to turn an arc into a circle.
- How to draw a quadratic curve.
- How to draw a Bezier curve.
- Interactive programmes to practise the role of centre and end points.
Finding a good book to master HTML5 can be very challenging: there are so many around - most with eye-catching titles and very complex substance.
Therefore,
Vivax Solutions strongly recommends
Core HTML5 Canvas for those who really want to delve into HTML5.
Please click the image to access
Amazon:
Arc
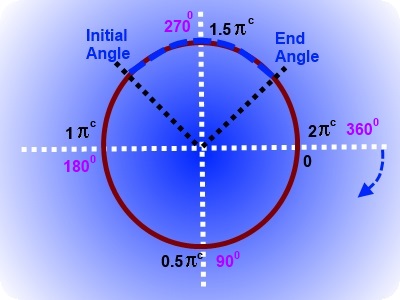
In order to draw an arc, we must specify a centre, a radius, a start angle, an end angle and the direction in terms of of a Boolean value - clockwise/anticlockwise.
The angles must be given in radians.
If you are not familiar with radians, you can easily convert degrees into radians by multiplying the value in degree by π/180.
It is very important to get a clear sense of the convention of measuring the angles. The following diagram explains this:
Convert 300 into radians.
30 * π /180
= 30 * π / 180
= π/6
= 0.5235c
E.g.
context.arc(200, 150, 80, 1.25π, 1.75π, false) draws an arc of 80 pixels, as follows:
You can change its shape by giving the initial angle and final angle in degrees - 00 to 3600 - in the following text boxes:
Ini_Angle: End_Angle:
The Code for an Arc is as follows:
<canvas id="Canvas_Four" width="400" height="300" style="border:5px solid red;"></canvas>
<script type="text/javascript">
var canvas = document.getElementById('Canvas_Four');
var cnt = canvas.getContext('2d');
// Draw an arc
cnt.beginPath();
cnt.arc(200, 150, 80, 1.25*Math.PI, 1.75*Math.PI, false);
cnt.lineWidth = 8;
cnt.strokeStyle = "blue";
cnt.stroke();
</script>
Quadratic Curve
A quadratic curve, also known as a parabola in mathematics, can be drawn on canvas by context.quadraticCurveTo() method.
First of all, context.moveTo() method must be used to specify the beginning of the curve, also known as the context point. The two arguments of context.quadraticCurveTo() method are the pair of coordinates of the centre point and end point respectively.
First, read the code; then, click the interactive button to see the effect on the curve on the canvas, when the centre point is changed.
Coordinates of the Centre Point:
The Code for Quadratic Curve is as follows:
<canvas id="Canvas_Five" width="400" height="300" style="border:5px solid red;"></canvas>
<script type="text/javascript">
var canvas = document.getElementById('Canvas_Five');
var cnt = canvas.getContext('2d');
cnt.beginPath();
// beginning of the curve - context point
cnt.moveTo(100, 250);
// coordinates of the centre point and end point
cnt.quadraticCurveTo(200,100, 300, 250);
cnt.lineWidth = 10;
// line color
cnt.strokeStyle = 'green';
cnt.stroke();
Bezier Curve
A Bezier curve can be drawn on canvas by context.bezierCurveTo() method.
First of all, context.moveTo() method must be used to specify the beginning of the curve, also known as the context point. The three arguments of context.bezierCurveTo() method are the sets of coordinates of two control points and the end point respectively.
First, read the code; then, click the interactive button to see the effect on the curve on the canvas, when the control points are changed.
The Code for Bezier Curve is as follows:
<canvas id="Canvas_Five" width="400" height="300" style="border:5px solid red;"></canvas>
<script type="text/javascript">
var canvas = document.getElementById('Canvas_Five');
var cnt = canvas.getContext('2d');
cnt.beginPath();
// beginning of the curve - context point
cnt.moveTo(100, 250);
// coordinates of the centre point and end point
cnt.quadraticCurveTo(200,100, 300, 250);
cnt.lineWidth = 10;
// line color
cnt.strokeStyle = 'green';
cnt.stroke();
All Canvas Animations