Errors and Uncertainties
Please use Google Chrome or Mozilla FireFox to see the animations properly.
In this tutorial, you will learn the following:
- SI Units
- Difference between Mistakes and Errors
- Measurement Errors
- Random Errors
- Systematic Errors
- Accuracy
- Precision
- Absolute Uncertainty
- Percentage Uncertainty
- Combining Uncertainties
- Errors and Uncertainties for A Level Physics (Practical) - AQA, Edexcel and OCR
This is what you need to know for your AS, A-Level or IB curriculum involving errors and uncertainties; they are covered comprehensively in such a way that you don't need any additional information to complement them.
SI Units
These are fundamental units of physical quantities.
E.g.
kg - for mass
m - for length
K - temperature
mol - for the amount of substance
Amp - for current
s - for time
We can derive other units from the base units, known as SI units
E.g.1
Pressure = force / area = mass X acceleration / area
= N/m² = kgms-2/m² = kgm-1s-2
The units of force and pressure are N and Pa, yet they are not the base units - SI units.
E.g.2
Derive the SI units of energy.
Potential energy = mgh
= kg X ms-2 X m
= kg m2s-2
Food for Thought: We use 5kg to represent mass and 10W to represent the power of a bulb. How do you account for the use of upper case and lower case characters in each case?
Practice
Derive the SI units of the following:
eV - electron Volt
kWh - kiloWatt hours
Errors and Mistakes
Suppose you are carrying out an experiment involving a simple pendulum inside a lab, while measuring the length of the pendulum and the time period. Just imagine that it's windy outside and you forgot to close a window properly in the vicinity, while inadvertently letting a mild draught in. Afterwards, someone points out the effect of draught on the experiment. In this case, you made a mistake.
Now, you make a decision to repeat the experiment while rectifying the mistake - by closing the window properly. So, mistakes are avoidable and can, in most cases, be rectified easily.
An error, on the other hand, is the difference between the real value and the experimental value. Errors stem from the faulty devices used in the experiments as well as flawed designs of the experiments. They are inevitable and all we can do is to keep them to a minimum.
In short, mistakes are not errors; there is a clear distinction between the two.
Measurement Errors
The true value is a value that you obtain from a data book or from an experiment in ideal conditions.It is certainly going to be different from a measured value. The difference between the true value and the measured value is a measurement error.
E.g.
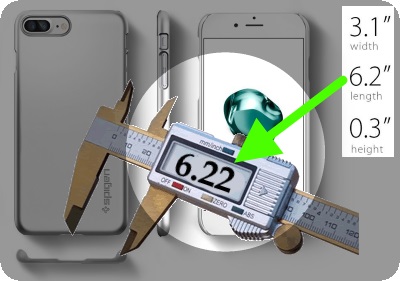
In the above image, a smartphone manufacturer gives us the length, width and height of the phone. We take them for granted by assuming they are true values. However, if we measure them, say, with a Vernier calliper, the measured values may not be the same. So, the differences between the true values and measured values, in this case, constitute measurement errors.
There are two types of measurement errors:
- Random Errors
- Systematic Errors
Random Errors
Random errors occur when measurements are being made; as a result, the measurements may vary in unpredictable ways, which could result in a significant deviation from the true value.
E.g.
Let's say a resistor, bought from an electronic shop, shows that its resistance is 12Ω. If we measure it by a multimeter, it may show values such as 12.5, 13, 13.7 or even 14. The variation in measurements may be due to:
- The change in the temperature due to the current
- The difficulty in taking the measurement from the multimeter
Since the control of both factors are beyond us, it is clear that random errors cannot be corrected. All we can do is making more measurements and then finding the mean of them. In addition, we can make use of high-resolution equipment and resort to data-logging with the aid of a computer to deal with random errors.
Systematic Errors
Systematic errors, by contrast, occur when measurements are being made and the error values may seem to be consistent during the period in which the experiment is carried out.
E.g.
A thermometer placed inside a hole of a warming iron block may not record the correct temperature due to the following:
- Poor contact between the thermometer bulb and the surface of iron.
- A fault in the the scale of the thermometer - without resting at 0C0, when placed in melting ice.
As you can see, unlike random errors, systematic errors can be corrected; in order to rectify the above errors, we can do the following:
- Filling the hole with mercury in order to make a good contact between the thermometer bulb and the iron block.
- Using a thermometer that has a reliable scale attached to it.
Ad: Revision cards for A Level Physics:


Precision and Accuracy
We may use the two terms casually; they, however, are not the same in the realm of physics.
Accuracy:
This is the closeness of the measured values to the true value.
Precision:
This is the closeness of the measured values to each other: the closer they are to each other, the more precise they are.
The following animation will help you distinguish between accuracy and precision.
Finding a good text book - without space-devouring silly cartoons - for physics can be as challenging as mastering the subject.
So,Vivax Solutions highly recommends the following books for you to complement what you learn here:Practice in Physics contains a huge collection of problems for practising; A-Level physics is a great text book to get an in-depth understanding of every major topic in physics.
Uncertainty in Measurement
The interval in which the true value lies is called the uncertainty in the measurement.
Absolute Uncertainty or ± value
The absolute uncertainty in the mean value of measurements is half the range of the measurements.
E.g.
Suppose the measurements of the diameter of a pin by a Vernier Calliper are as follows:
0.25mm; 0.24mm;0.26mm; 0.23mm;0.27mm;
The mean = (0.25 + 0.24 + 0.26 + 0.23 + 0.27)/5 =125/5 = 0.25mm
The range = 0.27 - 0.23 = 0.04mm
Absolute Uncertainty = ± 0.04/2 = ± 0.02
So, the mean value = mean ± range/2
= 0.25 ± 0.04/2
= 0.25 ± 0.02
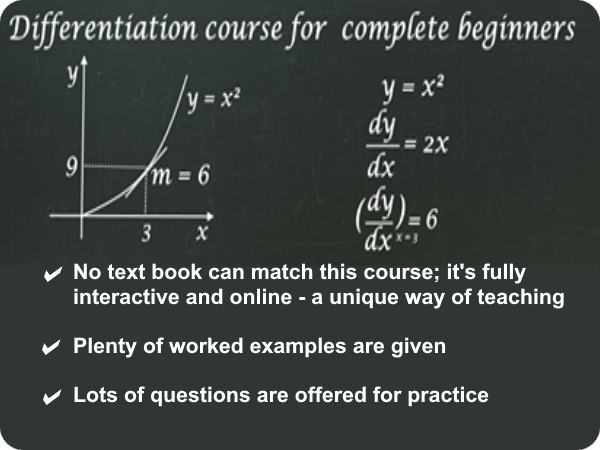
Ad: The author of this site offers fully interactive tutorial on differentiation
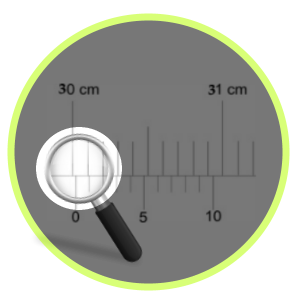
Interactive Vernier Calliper
With the following animation, you can interactively practise the working of a Vernier Calliper. move the slider so that Vernier scale moves along the main scale and then observe the measurements.
Please move the slider and study the readings.
Measurements and Absolute Uncertainty - interactive
You can practise the uncertainty interactively with the following applet; just move the slide to choose the desired value and observe the lower and upper bounds of the potential measurements.
The pen shows a reading between 47 and 48 mm on the scale. Depending on the precision that you choose, or the absolute uncertainty, the possible values of lower and upper bound are automatically calculated.
Percentage Uncertainty
Percentage Uncertainty = (Absolute Uncertainty/Mean Value) x 100
E.g.
In the above example,
Percentage Uncertainty = (0.02/0.25)x 100 = 8%
Exceptions:
Sometimes, the multiple measurements that you take could be the same, leaving you with no variation or range. In other words, absolute uncertainty turns out to be 0! This situation can also arise
when you have a single measurement. In such circumstances, the resolution of the device - the smallest measurement possible - comes to our rescue. The resolution is taken as the absolute uncertainty.
E.g.
- If the device in question is a meter rule, the resolution, 1mm, is the absolute uncertainty.
- If the device is a Vernier Calliper, the resolution, 0.01mm, is the absolute uncertainty.
- If the device is a micrometer, the resolution, 0.01mm, is the absolute uncertainty.
If the single measurement by a Vernier Calliper is 23.2mm or every measurement is 23.2mm in a series of measurements, the length = 23.2 ± 0.01
Food for thought: 2 ± 0.645 is not the right way show absolute uncertainty. Why?
E.g.
The number of lines carved on a diffraction grating stands at 3.5x10³ per metre. Find the percentage uncertainty, grating spacing and absolute uncertainty in the number of lines per metre.
The value is correct to 1 decimal place - the smallest possible measurement or resolution. So, true value can be anywhere between 3.45x10³ per metre and 3.55x10³ per metre.
Percentage uncertainty = 0.1x10³ / 3.5x103 x 100 = 2.9%
Grating spacing = 1/3.5x103 = 0.29 mm
As the above is correct to two decimal places,
Absolute uncertainty = ± 0.01 mm
Combining Uncertainties
Case 1
When you add or subtract quantities in an equation, absolute uncertainty of each value is added together.
E.g.1
The length of a copper wire at 30C0 is 18.2mm ± 0.04 cm and at 60C0 19.7mm ± 0.02 cm. Find the absolute uncertainty and the extension of the wire.
Absolute uncertainty = 0.04 + 0.02 = 0.06
Extension of the wire = (19.7 - 18.2) ± 0.06
= 1.5mm ± 0.06
E.g.2
The mass of the water bottle of an avid walker, before and after a walk, is 300g and 127g respectively. If the absolute error is 0.5g, find the loss of mass of water, correct to the appropriate degree of accuracy.
Mass before the walk = 300 ± 0.5g
Mass after the walk = 127 ± 0.5g
Mass of the water used up = (300 - 127) + 2*0.5 ±
= 173 ± 1g
Case 2
When you multiply or divide quantities in an equation, percentage uncertainty of each value is added together.
E.g.
The weight of an iron block is 8.0 ± 0.3 N and is placed on a wooden base of area, 3.5 ± 0.2 m2. Find the percentage uncertainties of the values and then calculate the pressure exerted by the block.
Percentage uncertainty in the weight = (0.3/8) x 100 = 3.75
Percentage uncertainty in the area = (0.2/3.5) x 100 = 5.71
% uncertainty = 3.75 + 5.71 = 9.46
Pressure = 8/3.5 = 2.3 Pa
Absolute uncertainty in the pressure = (9.46/100) x 2.3 = 0.22 - absolute uncertainty = percentage uncertainty x mean measurement
Since b7oth the weight and the area have been approximated to two significant figures, the final answer must take the same form:
Pressure = 2.3 ± 0.22 Pa
Case 3
When you raise a measurement to the power n, the percentage uncertainty is multiplied by n.
E.g.1
Suppose the length of a cube is given as 5.7 ± 0.2 cm and you want to find the absolute uncertainty in the volume.
Volume = 5.73 = 190 (2 s.f.)
Since V = l3, Percentage uncertainty = 3 x (0.2/5.7) x 100 = 10.5
Absolute uncertainty in the volume = 190 ± 10.5 (2 s.f.).
E.g.2
The diameter of disk has been measured as 5mm with absolute uncertainty 0.1mm. Find the area of the disk.
Diameter = 5mm ± 0.1
Area = πd2 / 4 ± 2 x 0.1
= 19.6mm2 ±0.2
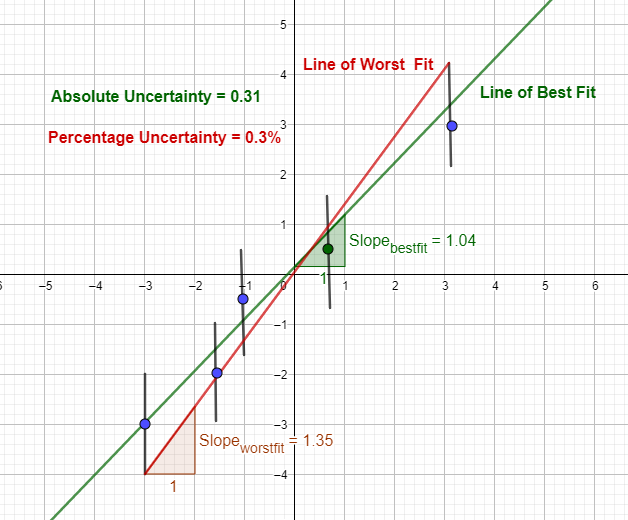
Error bars, line of best fit and line of worst fit
When data is plotted based on the experimental data, an error bar can be created for each data point, either vertically, horizontally or even in both directions.
If the absolute uncertainty is b and the y value is a,
y values of error bar = a ± b
This way, error bars can be constructed for each data point. Then, the line of best fit and the line of worst fit - connecting the lowest error bar value and the highest error bar value - can be drawn.
Absolute Uncertainty = Positive value of the difference of gradient between the line of best fit and the line of worst fit
Percentage Uncertainty = absolute uncertainty / gradient of the line of best fit X 100
Absolute uncertainty in the above example = |1.04 - 1.35| = 0.31
Percentage uncertainty in the above example = 0.31/1.04 X 100 = 0.3%
E.g.
The following table shows data of mass and volume of certain objects. Write the correct value in the blue box, while taking into account the rest of the data in the density column.
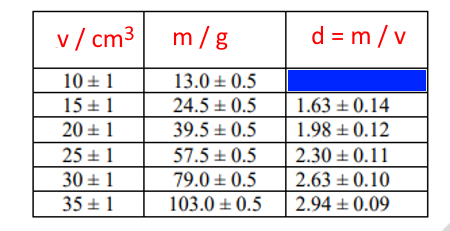
Percentage uncertainty of volume = 1/10 X 100 = 10%
Percentage uncertainty of mass = 0.5/13 X 100 = 3.8%
Percentage uncertainty of density = 0.1 + 0.038 = 0.138
Density = 13/10 = 1.3
Absolute uncertainty of density = density x percentage uncertainty = 1.3 X 0.138 = 0.18
The data in the blue cell = 1.3 ± 0.18
Now that you have read this tutorial, you will find the following tutorials very helpful too: