Venn Diagrams
In this tutorial, you will learn:
- A brief introduction of Venn, the inventor
- Union, Intersection and Complementing
- OR and AND Rules
- Venn Diagram and probability - fully interactive
- Worked examples, involving union and intersection
Please choose an option and then see its logical meaning.
A Venn diagram, invented by John Venn, is a collection of closed curves drawn, usually, inside a rectangle. John Venn is a British mathematician, who also campaigned against both slavery
and cruelty to animals. Venn Diagrams are widely used in the field of statistics, computer science, probability theory and set theory.
Please choose the logical relationship from the table and the corresponding image will appear to explain the meaning.
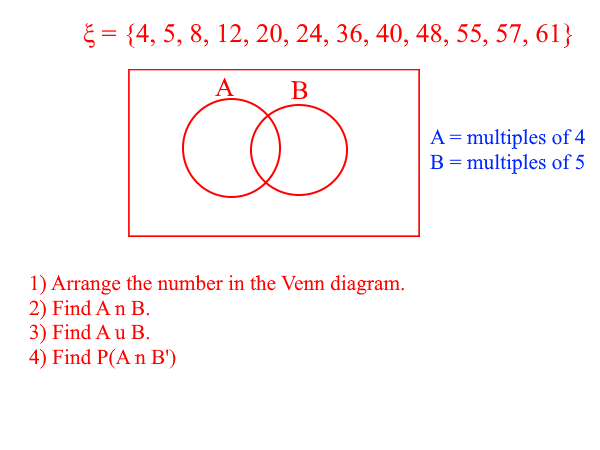
Practice 1
Click the Run button to generate the items inside the circles, as many times you want; ignore everything on the borders of the circles:
Find the following:
- A U B
- A n B
- A U B
- A''
- A U B'
- A' n B'
Practice 2
There are 40 pupils in a class:15 do maths; 20 do biology; 8 do neither. Find the number who do both subjects.
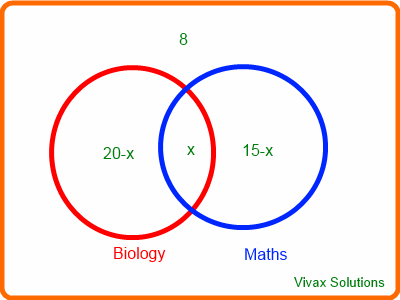
Let the number who do both be x.
20-x + 15-x + x + 8 = 40
x = 3
The number who do both = 3.
Venn Diagrams and Probability
Suppose there are 60 students in a certain class: 30 of them are doing maths; 20 of them doing biology; 15 of them doing neither. Draw a Venn diagram
to represent this data and hence find the following:
A randomly chosen student doing,
- Maths
- Only maths
- Biology
- Maths and Biology
- Maths or Biology
- Neither
- Doing biology, given that he or she doing maths
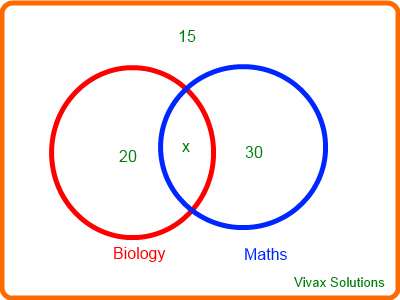
Let the number of doing both be x,
So, 30-x + 20-x + x + 15 = 60
x = 5
- P(M) = 30/60 = 1/2
- P(Only Maths) = 25/60 = 5/12
- P(B) = 20/60 = 1/3
- P(M n B) = 5/60 = 1/12
- P(M U B) = 45/60 = 3/4
- P(Neither) = 15/60 = 1/4
- Let's focus on maths sphere first; 5 of them are doing biology.
So, P(B / M) = 5/30 = 1/6.
From these observations, the following facts can easily be derived:
P(M) + P(B) - P(M n B) = 1/2 + 1/3 - 1/12 = 6/12 + 4/12 - 1/12 = 9/12 = 3/4
P(M U B) = 3/4
Therefore,
P(M U B) = P(M) + P(B) - P(M n B)
If M and B are mutually exclusive, P(M n B) = 0.
Therefore,
P(M U B) = P(M) + P(B)
This is known as OR Rule in probability.
P(M n B) / P(M) = (1/12) / (1/2) = 1/6
P(B / M) = 1/6
Therefore,
P(B / M) = P(M n B) / P(M)
If M and B are independent - M not influencing B or vice versa
P(B / M) = P(B)
So, P(B) = P(B n M) / P(M)
P(B) X P(M) = P(B n M) or,
P(B n M) = P(B) X P(M)
This is known as AND Rule in probability.
Now follow the worked examples on Venn Diagrams.
Venn Diagrams - worked examples
E.g.1
The probabilities of event L and event M are 0.4 and 0.7 respectively. If P(L n M) = 0.35, find the following:
1) P(L / M)
2) P(M / L)
3) Are L and M independent? Explain your answer.
1) P(L / M) = P(L n M)/P(M)
= 0.35/0.4 = 0.875
2) P(M / L) = P(M n L)/P(L)
= 0.35/0.7 = 0.5
3) P(L / M) is not the same P(L); P(M / L) is not the same as P(M) either. Therefore, events L and M are not independent.
E.g.2
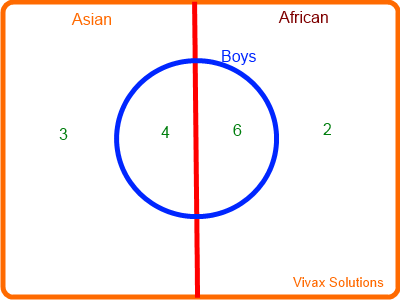
There are two groups of children in a classroom: an Asian group with 3 girls and 4 boys; an African group with 2 girls and six boys. Two children are chosen at random. Find the following:
1) Probability of them from the same ethnic group
2) Probability of them from the same gender
3) Probability of them from the same ethnic group and from the same gender
4) Probability of them from the same gender, given that they are from the same ethnic group.
1) Asian, Asian or African, African
P(same ethnic group) = 7/15 x 6/14 + 8/15 x 7/14 =7/15
2) Boy, Boy or Girl, Girl
P(same gender) = 10/15 x 9/14 + 5/15 x 4/14 =11/21
3) Asian Boy, Asian Boy or Asian Girl, Asian Girl or African Boy, African Boy or African Girl, African Girl
P(same ethnic group and same gender) = 4/15 x 3/14 + 3/15 x 2/14 + 6/15 x 5/14 + 2/15 x 1/14 = 5/21
4) P(same ethnic group / same gender) = P(same ethnic group n same gender) / P(same gender)
= (5/21) / (11/21) = 5/11
E.g.3
Given that P(X) = 0.7, P(Y) = 0.4 and P(X U Y) = 0.8, find the following:
1) P(X n Y)
2) P(X/Y)
3) P(Y/X)
4) P(X/Y')
5) Are X and Y independent? Explain the answer.
This question can be worked out even without a Venn Diagram.
1) P(X U Y) = P(X) + P(Y) - P(X n Y)
0.8 = 0.7 + 0.4 - P(X n Y)
P(X n Y) = 0.3
2) P(X/Y) = P(XnY)/P(Y)
= 0.3/0.4 = 0.75
3) P(Y/X) = P(YnX)/P(X)
= 0.3/0.7 = 0.42
4) P(X/Y') = P(XnY')/P(Y')
=( P(X) - P(X n Y))/1 - P(Y) = (0.7-0.3)/(1-0.4) = 0.4/0.6 = 2/3
5) Since P(X/Y) is not equal to P(X) and P(Y/X) is not equal to P(Y), X and Y are not independent.
E.g.4
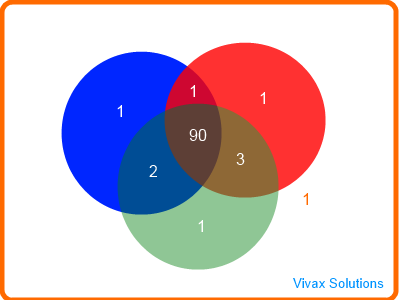
A survey has been carried out to find the favourite colour of 100 teenagers. The results are as follows:
- red - 95
- blue - 94
- green - 96
- red and blue - 91
- blue and green - 92
- red and green - 93
- all colours - 90
A teenager is randomly selected. Find the probability that he,
1) likes green, not red
2) likes any colour other than red
3) likes none of the colours
4) only two colours
5) likes green, given that he likes red
1) 3/100
2) 5/100 = 1/20
3) 1/100
4) 6/100 = 3/50
5) 93/95
Practice 3